
The U.S. Census Bureau released the latest American Community Survey five-year statistics today, offering a snapshot of the community social and economic characteristics previously only available once a decade from the census. As the nation’s largest ongoing household survey, the American Community Survey produces statistics annually at all levels of geography, down to the block group level for every community in the nation and Puerto Rico.
Some take-aways:
- Richmond’s population is estimated to be 211,063, up 3.4% from the official 2010 talley of 204,214
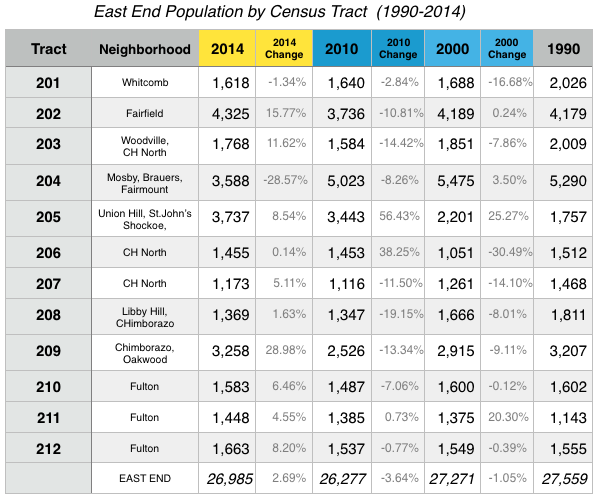
- The East End’s population is estimated to be 26,985, up 2.69% from 2010. This is the first time since at least 1990 that the population of the East End has not fallen.
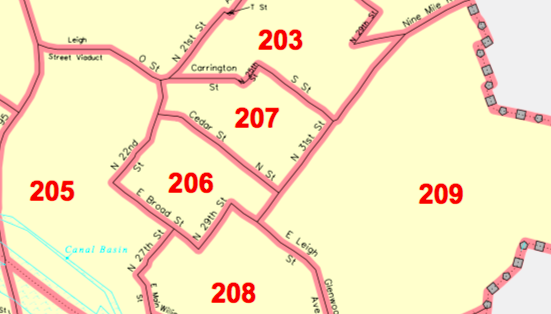
- In 2010, tracts 205, 206, and 208 flipped to become white-majority. In this current tally, these are also the 3 tracts with the lowest percentage of the population as children (see below).
- There have been population increases virtually across the entire area with the exception of Whitcomb, and Mosby South/Brauers/Fairmount.
- The population in Chimborazo/Oakwood jumped 29%.
- The decline in the Mosby South/Brauers/Fairmount area was enough to offset the gains everywhere else. (I’m having a difficult seeing how there are 1,500 fewer residents in that area, for real. – John)
[sep]
[sep]

[sep]

For the sake of the math, this tally includes the 12 census tracts in the city east of I-95, south of I-64, and north of the James River (map PDF).
12 comments
Brian Hall liked this on Facebook.
Freda Green-Bolling liked this on Facebook.
Jolinda Smithson liked this on Facebook.
Kathy Albers liked this on Facebook.
Kristen Hudacek liked this on Facebook.
Morgan A. Huff liked this on Facebook.
Katarina Pace liked this on Facebook.
Tina Bujno liked this on Facebook.
Definitely didn’t need the census bureau to tell us. The traffic and lack of parking on the hill has certainly been telling enough!
Ciarra Pollard liked this on Facebook.
Harvey Tracey liked this on Facebook.
Ann Schweitzer liked this on Facebook.