
Tipped to Eric Fischer’s set of Race and Ethnicity maps via Business Insider’s 21 Maps Of Highly Segregated Cities In America.
Race and ethnicity 2010: Richmond
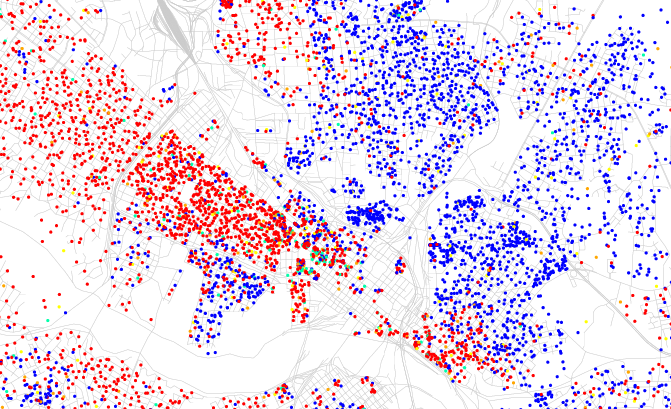
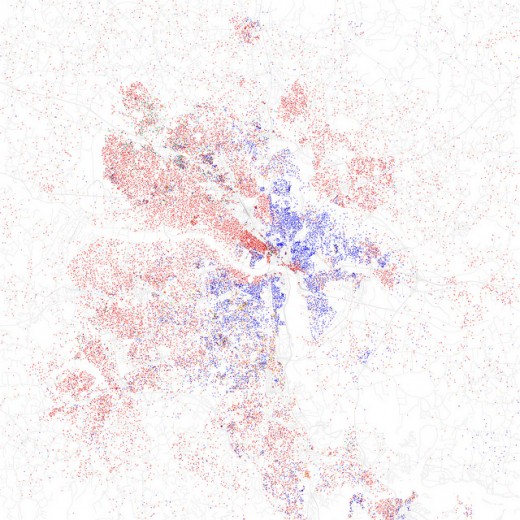
Maps of racial and ethnic divisions in US cities, inspired by Bill Rankin’s map of Chicago, updated for Census 2010.
Red is White, Blue is Black, Green is Asian, Orange is Hispanic, Yellow is Other, and each dot is 25 residents.
Data from Census 2010. Base map © OpenStreetMap, CC-BY-SA
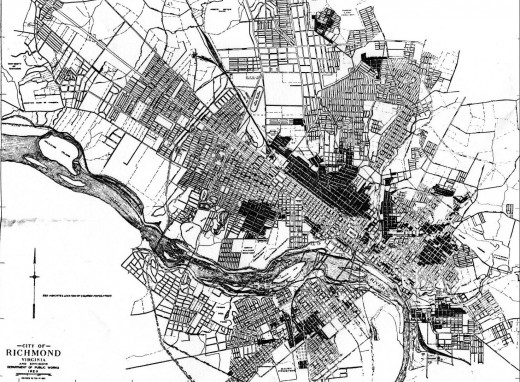
Here is a similar mapping from 1923:
1 comment